
In Part 1 we opened the hydraulic power unit and showed why hydraulics still own the high‑tonnage end of injection molding. This article answers the question every procurement manager eventually faces: which drive architecture should my next press be? We compare conventional hydraulic, servo‑hydraulic, and all‑electric machines on the metrics that actually hit the P&L — energy, precision, force limits, and ten‑year total cost of ownership — and finish with a decision matrix you can hand to your engineering team.
1The Energy Wake‑Up Call
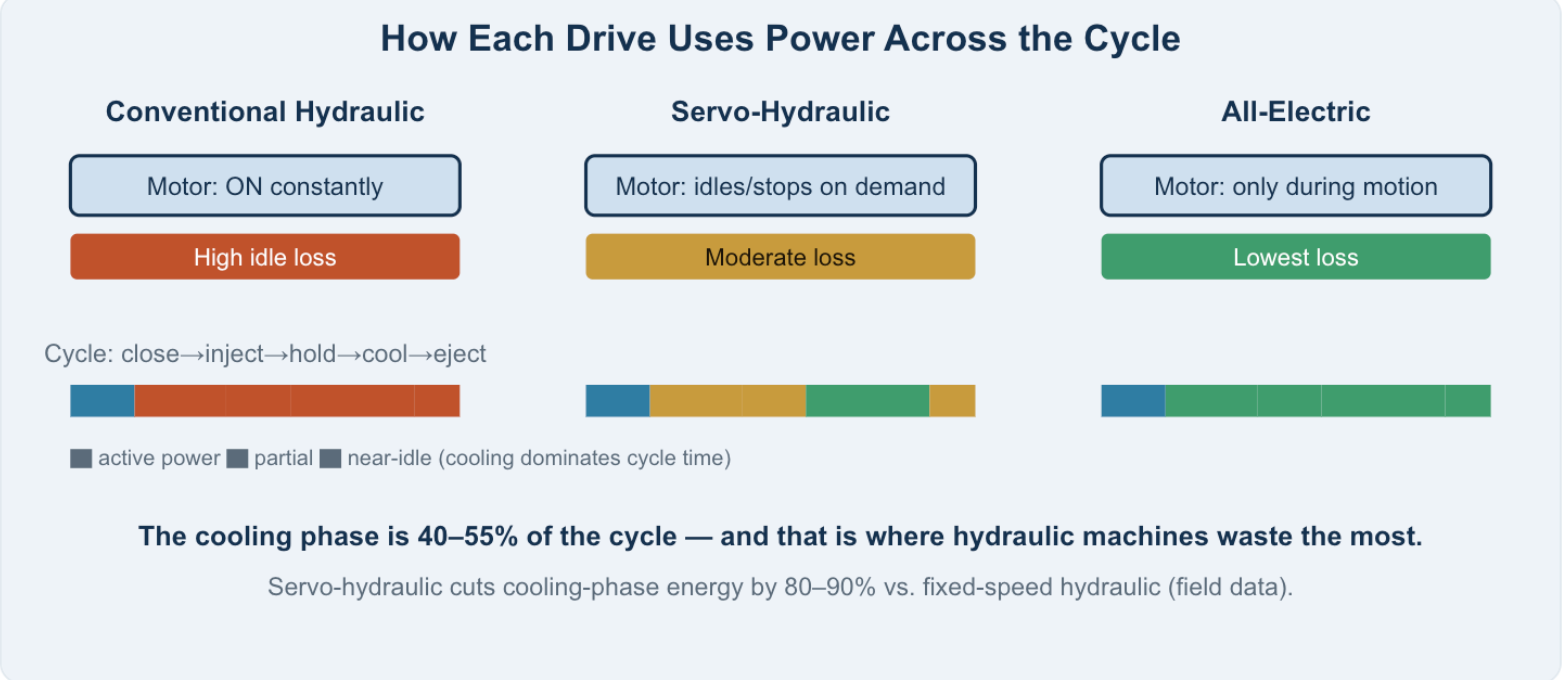
Injection molding is one of the most energy‑intensive discrete manufacturing processes. Published research (e.g., Journal of Cleaner Production) puts electricity at 30–45% of a molding cell’s total operating cost in serial production. For a fixed‑speed hydraulic press, the painful part is not the injection stroke — it is everything else. The pump runs at full speed continuously, drawing close to full motor power during mold cooling, dwell, and idle phases when almost no useful work is being done.
That single design choice — “the pump never stops” — is the difference between a machine that costs you money every shift and one that doesn’t. The three drive architectures below are, at their core, three different answers to the question: when should the power source actually be working?
2The Three Architectures, Explained
① Conventional Hydraulic
A fixed‑ (or variable‑) displacement pump spun by a constant‑speed AC motor. Oil is always available; valves meter it. Simple, cheap, rugged — but the motor draws power even when the machine is cooling.
② Servo‑Hydraulic
A servo motor + inverter drive the pump. The controller slows or stops the pump exactly when demand drops (notably during cooling), then accelerates instantly for the next stroke. Same hydraulics, demand‑driven power.
③ All‑Electric
Every axis — clamp, injection, plasticizing, ejection — is driven by a servo motor through a ball screw or linear drive. No hydraulics at all. Power is drawn only during motion.
A hybrid sits between ② and ③: typically an electric injection/plasticizing axis paired with a hydraulic clamp (or vice‑versa), capturing electric precision where it matters and hydraulic force where it’s cheapest.
3Energy Consumption, Quantified
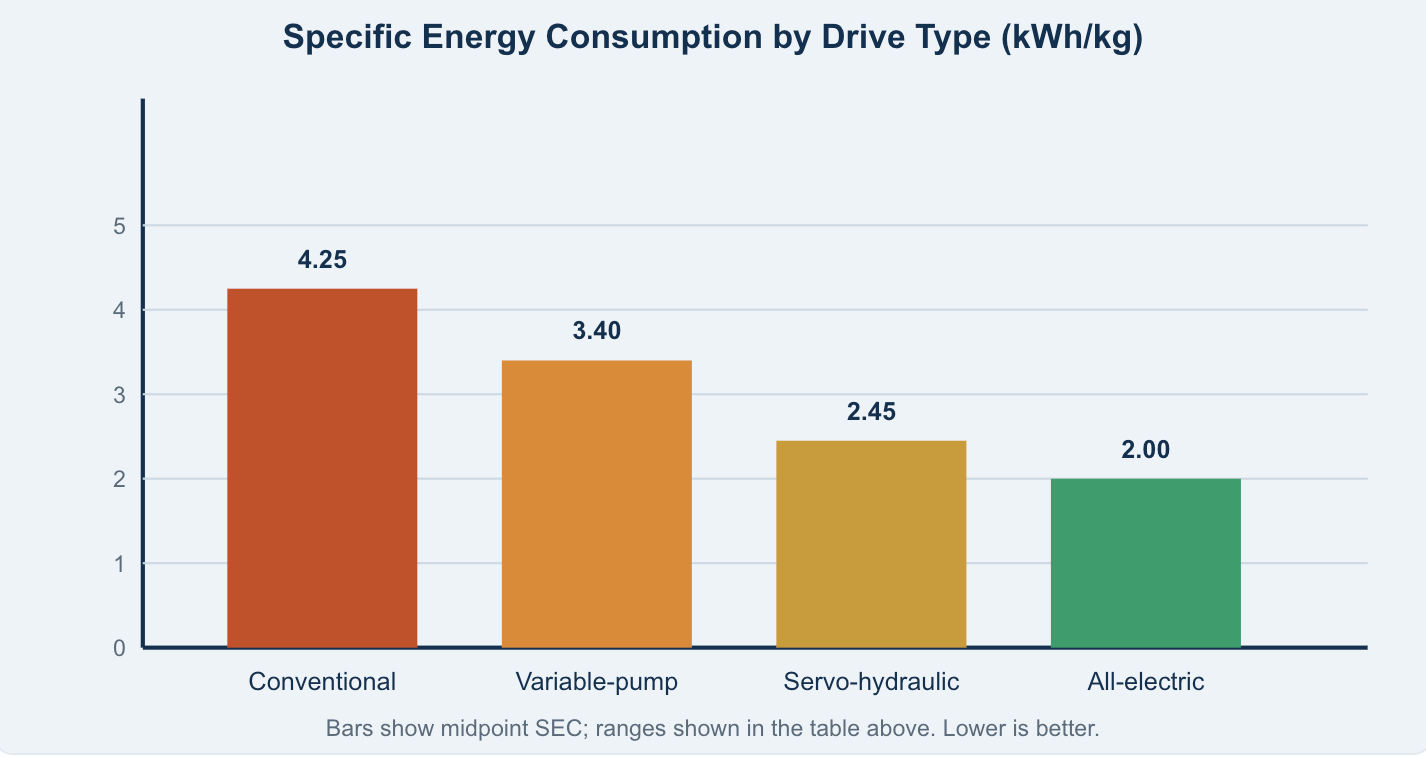
Specific Energy Consumption (SEC) — kWh of electricity per kg of molded part — is the fairest cross‑machine figure of merit because it normalizes for output. Field and peer‑reviewed benchmarks cluster as follows:
| Drive technology | Typical SEC (kWh/kg) | Reduction vs. conventional |
|---|---|---|
| Conventional fixed‑pump hydraulic | 3.5 – 5.0 | baseline |
| Variable‑pump hydraulic | 2.8 – 4.0 | up to ~20–30% |
| Servo‑hydraulic | 1.9 – 3.0 | up to ~40% |
| All‑electric | 1.5 – 2.5 | up to ~50% |
The most convincing evidence is measured, not marketing. A 2025–2026 instrumented study across 4 factories on 3 continents (220‑, 330‑, and 160‑tonne pairs running identical molds) recorded 42–63% lower electricity consumption for servo‑hydraulic machines versus their fixed‑speed hydraulic twins. The savings were concentrated almost entirely in cooling and idle phases — exactly where the conventional pump keeps spinning uselessly.
Rule of thumb for specifiers
- Don’t compare nameplate kW. Compare kWh/kg or kWh per 1,000 parts on your actual mold.
- For high‑run‑time presses, the energy delta alone often pays back the servo premium in 1.5–2.5 years.
- All‑electric is the floor for energy, but its advantage shrinks on long‑cycle, thick‑walled parts where cooling — not motion — dominates.
4Precision and Repeatability
Where electric machines clearly lead is dynamic response and shot‑to‑shot consistency. Ball screws driven by servo motors accelerate and decelerate faster and with less hysteresis than oil columns, and there is no oil compressibility or valve overlap to fight. Representative position repeatability:
| Drive | Position repeatability | Best‑fit application |
|---|---|---|
| Conventional hydraulic | ±0.10 mm | Large, thick‑walled, non‑critical parts |
| Servo‑hydraulic | ±0.03 mm | General precision, high‑tonnage |
| All‑electric | ±0.01 mm | Medical, optical, thin‑wall, micro |
For thin‑wall packaging, optical lenses, and medical components where scrap rate is driven by dimensional drift, all‑electric (or electric‑injection hybrids) is the standard. But note: a well‑tuned servo‑hydraulic with closed‑loop proportional valves closes most of the perceived “precision gap” for the vast majority of technical parts.
5Force, Tonnage, and Part Geometry
This is hydraulics’ home turf. Generating very high clamp force electrically means oversized ball screws and gearboxes, which inflates capital cost and reduces stiffness. Practical boundaries:
- Hydraulic / servo‑hydraulic: economical from ~50 up to 4,000+ tonnes; ideal for large automotive, bin, and crate parts, thick walls, and multi‑core molds.
- All‑electric: strongest below ~300–500 tonnes; above that, cost and size penalties grow fast. Large‑container and bumper applications stay hybrid for robustness.
- Hybrid: the sweet spot for applications wanting electric injection precision with hydraulic clamping force.
6Total Cost of Ownership Over 10 Years
Purchase price is the smallest part of the story. A realistic TCO stacks energy, maintenance, consumables, downtime, and resale:
| Cost element | Conventional hydraulic | Servo‑hydraulic | All‑electric |
|---|---|---|---|
| CapEx (relative) | Lowest | +15–25% | +20–40% |
| Energy | Highest | ~40% lower | ~50% lower |
| Hydraulic oil & cooling | Yes (full volume) | Reduced 50–70% | None |
| Maintenance hrs/yr | ~120+ | ~80 | ~40 |
| Cleanroom fit | Oil mist risk | Lower risk | Best (oil‑free) |
| Resale after 10 yr | ~25% | ~35% | ~45% |
| Payback on premium | — | 1.5–2.5 yr | 2–4 yr (high volume) |
Multiple reliability studies (incl. U.S. DOE Industrial Technologies) show disciplined maintenance prevents roughly three‑quarters of major hydraulic failures before they happen — so the “high maintenance” reputation of hydraulics is partly a discipline problem, not a technology verdict.
7Decision Matrix: Which Drive Should You Specify?
| If your priority is… | Best choice | Why |
|---|---|---|
| Lowest upfront cost, simple large parts | Conventional hydraulic | Cheapest CapEx; adequate where energy and precision aren’t critical |
| High‑volume production, mixed parts, >500 T | Servo‑hydraulic | Biggest energy savings at scale; preserves hydraulic force; fast payback |
| Medical / optical / thin‑wall / micro | All‑electric | Best repeatability, cleanroom‑ready, lowest energy |
| Electric precision + high clamp force | Hybrid | Electric injection accuracy with hydraulic tonnage |
| Cleanroom / low‑contamination mandate | All‑electric | No hydraulic oil loops, no mist |
| Very large parts (>1,000 T, thick wall) | Hydraulic / servo‑hydraulic | Only economical way to reach extreme tonnage |
8Keeping Hydraulics Healthy (If You Stay Hydraulic)
Whether conventional or servo‑hydraulic, hydraulic reliability lives or dies on two numbers: cleanliness and temperature.
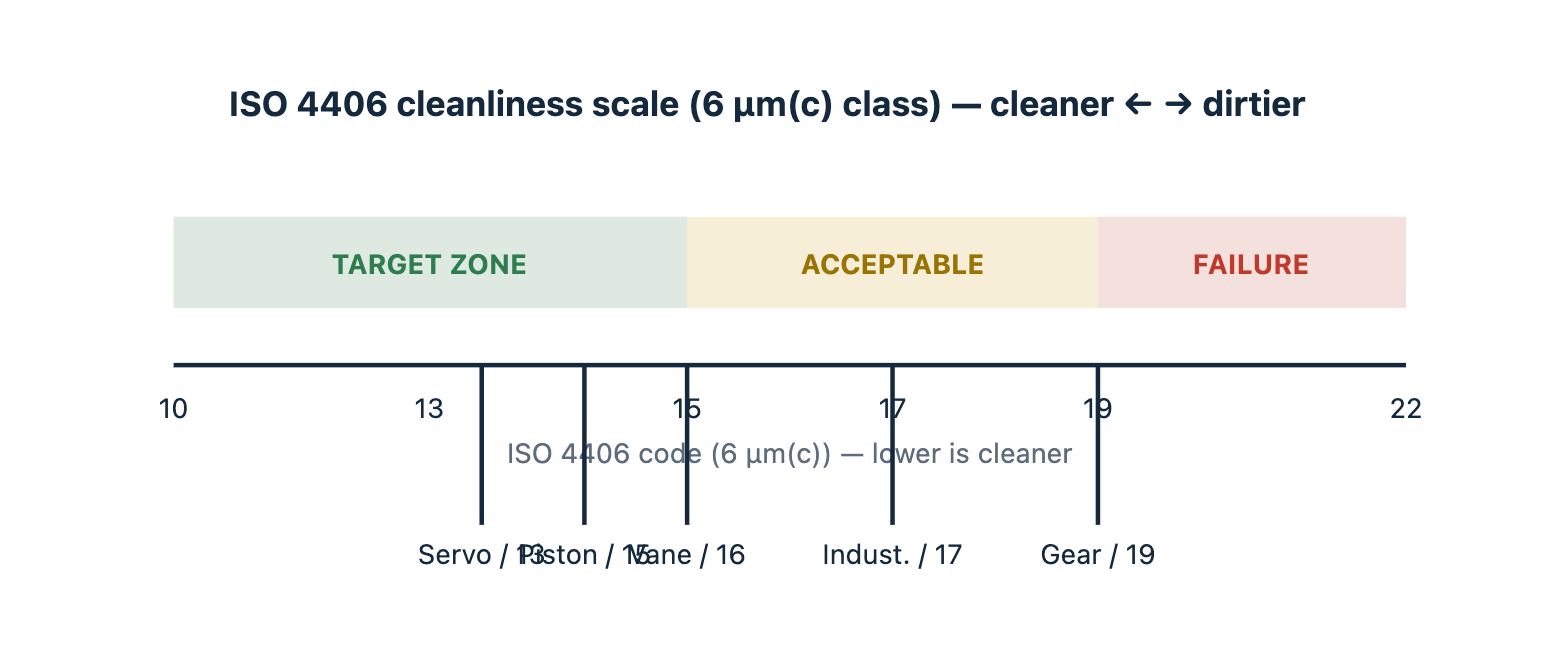
- Target ISO 4406 18/16/13 or better. Particle contamination is the #1 cause of valve stiction, pump wear, and mysterious pressure drops.
- Hold oil at 40–55 °C. Above ~60 °C, oxidation and seal degradation accelerate sharply; below ~35 °C, viscosity rises and response lags.
- Watch for the classic failure signals: slowly lengthening cycle times (worn pump, internal leakage), inability to reach tonnage (relief valve or seal issue), overheating (cooler fouling), and erratic injection (contaminated proportional valve).
- Move to predictive maintenance. Pressure‑transducer trending, oil‑particle counters, and controller alarm logs now feed Industry 4.0 dashboards that flag degradation weeks before breakdown.
9What the Market Is Actually Doing in 2026
The data settles the “is hydraulics dead?” debate: not even close. In 2026, servo‑hydraulic machines accounted for roughly 49–72% of revenue across major market segments — the clear volume leader — because they deliver most of the electric energy benefit while keeping hydraulic force and lower cost. All‑electric holds a growing but still niche share (~8–30% depending on segment), strongest in automotive, electronics, and medical where precision and cleanroom requirements dominate. Hybrid sits in between and is slowly ceding points (~1.5–2% per year) as all‑electric matures, yet remains substantial in Asia‑Pacific and for very large parts.
10The Outlook: Electrification, but Not Overnight
The trajectory is clear — more electric axes, smarter servo‑hydraulic control, and software‑led differentiation. Leading OEMs are shifting from selling iron to selling integrated automation and AI process optimization (e.g., cloud platforms that auto‑tune injection profiles and predict maintenance). But for the foreseeable future the floor will be a mix: electric where precision and cleanliness command a premium, hydraulic where force and cost do. The smart buyer specifies by application, not by fashion.
Bottom line
- Conventional hydraulic still wins on lowest CapEx for undemanding, large parts.
- Servo‑hydraulic is the high‑volume default — best blend of savings, force, and cost, with 1.5–2.5 yr payback.
- All‑electric is worth the premium for precision, cleanroom, and high‑run‑rate small parts.
- Specify on kWh/kg, tonnage, tolerance, and 10‑year TCO — never on sticker price alone.
All‑Electric
Energy Efficiency
Machine Selection
Predictive Maintenance


1 comment
zanini
Solid engineering guide! Love the emphasis on looking at 10-year TCO and kWh/kg rather than just upfront CapEx. Doing things right and making informed equipment choices upfront saves so much headache down the road. Thanks for sharing!